

1Why I built it
The repo's description starts “I had a theory AI would impact hiring this year” and ends “Let's find out together.” The first README was less restrained. It promised to track job losses “while we still have jobs to track” and mentioned, in brackets, my career prospects.
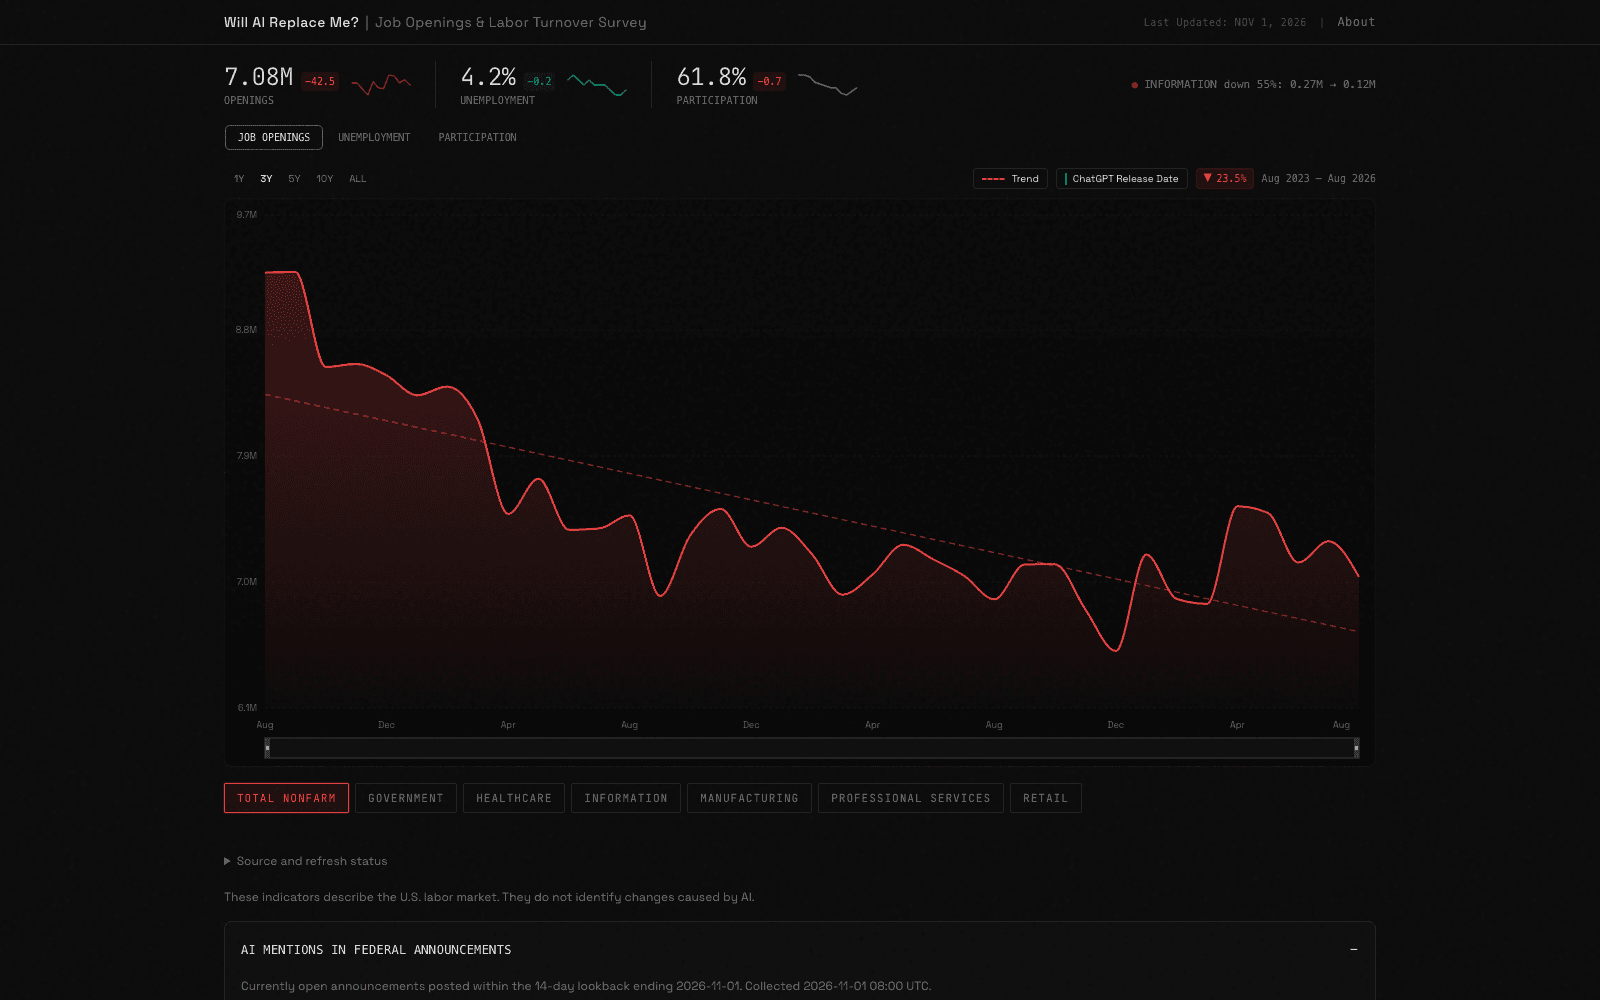
The first version went up on January 19, in fifteen commits over one afternoon. It's a Next.js site with a Convex backend: Convex stores the numbers and runs the scheduled jobs that fetch them, and Recharts draws the charts. You can look at job openings by industry, the unemployment rate or labour force participation, over one to ten years, with a trend line if you want one.
People started asking for things that afternoon. Participation was a request, and so was a line marking ChatGPT's release in November 2022; both people are credited on the site. A developer, @grandSpecial, sent a pull request that counted AI keywords in federal job ads from USAJOBS. I moved it into the Convex backend, merged it by hand before the day was out and credited him in the README and on the About page. The repo is public and MIT licensed.
2Where the numbers come from
The labour numbers come from the Bureau of Labor Statistics' public API. Job openings are from JOLTS, the Job Openings and Labor Turnover Survey, which surveys about 21,000 establishments a month on how many positions they're trying to fill. Unemployment and participation come from the Current Population Survey. Convex checks BLS every day for revisions and again on the seventh of each month for new releases. The same JOLTS series, total nonfarm job openings, also decides how crowded the job claw machine is.
The AI part comes from USAJOBS, the federal government's job board. Once a day the dashboard collects every open federal announcement posted in the last 14 days, removes duplicates and looks for a fixed list of terms: machine learning, large language model, PyTorch, ChatGPT, GitHub Copilot and eleven more. On November 1, 2026 it counted 8,012 open announcements. Fifty-seven of them mentioned AI, which is 0.7%.
3What the audit found
In September, eight months after launch, I went through all of it: the code, the live database and every series ID against BLS itself. The good news came first. All 1,251 numbers stored in the database matched a fresh pull from BLS, so the charts were showing real figures correctly. The problems were in what was missing and in what the numbers were said to mean.
The dashboard asked BLS for fifteen series, and six of them don't exist. BLS said so in its response, in a message sitting next to a status of REQUEST_SUCCEEDED, and the importer only read the status. It marked every refresh a success and carried on with nine. That's why professional and business services never appeared as an industry, and why choosing health care on its own in the unemployment view showed “Loading data...” forever.
Returned data (9)“Series does not exist” (6)
Job openings
- Total nonfarm, returned dataJTS000000000000000JOL
- Manufacturing, returned dataJTS300000000000000JOL
- Health care and social assistance, returned dataJTS620000000000000JOL
- Retail trade, returned dataJTS440000000000000JOL
- Professional and business services, did not existJTS540000000000000JOLReplaced with JTS540099000000000JOL
- Information, returned dataJTS510000000000000JOL
- Government, returned dataJTS900000000000000JOL
Unemployment rate
- All industries, returned dataLNS14000000
- Manufacturing, returned dataLNU04032300
- Health care, did not existLNU04032622Removed
- Retail, did not existLNU04032400Removed
- Professional services, did not existLNU04032540Removed
- Information, did not existLNU04032500Removed
- Government, did not existLNU04032900Removed
Labour force participation
- All industries, returned dataLNS11300000
The AI numbers had a different problem. Federal job ads are sorted by occupation and BLS sorts by industry, and the code that joined the two was wrong in specific ways. Retail was counted from administrative and clerical jobs. Manufacturing included the code for education, labelled in a comment as transportation. The total and government both used the code for miscellaneous occupations. Each category also stopped at the first 250 ads, and the total added the categories together, so one ad could count twice. The badge said 1.2% and the panel said 1.56%.
The keyword list was loose. It counted “repair electrical transformers”, “use a clean rag to wipe surfaces” and “experience embedding tissue samples” as AI, because transformers, RAG and embeddings are AI words too. It also counted ads that said AI experience wasn't required, which is fine in a count of mentions and wrong in what the first README called it: the share of jobs that “require AI skills”.
The rest was quieter. The functions that write to the database were public and didn't check who was calling, so in principle anyone could have changed the numbers. When USAJOBS failed, the collector saved empty results and marked the refresh a success. The locked dependencies had published security advisories, five of them rated critical. And the About page said ChatGPT's launch in November 2022 lined up with the peak in job openings before the decline. In the dashboard's own data it wasn't a peak at all: December was higher, and the high point was March 2022, at 12.3 million. The first README had added “(coincidence?)”.
4What I changed
I fixed it the same day, in one pull request. Only the scheduled imports can write to the database now. The importer checks every series it asks for, keeps the last good numbers when a refresh fails and doesn't stamp a failed refresh as fresh. Professional and business services came back under the right series ID, checked against the BLS release table. The five industry unemployment rates are gone.
The federal panel was rebuilt around what it actually measures. It collects every open announcement in the 14-day window page by page, removes duplicates by ID and groups ads by the occupations USAJOBS lists for each one, under their real names, with no pretend industries. It shows a percentage only after a complete collection, and only for groups with at least 20 ads. The bare words transformers, rag and embedding are off the list, and the panel calls its results mentions, not requirements.
The tests went from 129 to 143, and the CI checks now include a type check and a production build. After a full re-import, all 1,390 observations across the ten series it now uses matched BLS, and the dependency audit came back clean. The first complete federal collection found 8,177 announcements across 414 occupational groups, with 87 keyword matches.
Some of it is still unproven. I checked the keyword matcher against seven real excerpts, which is a spot check, not a measure of how accurate it is. A proper test needs a representative labelled sample, and it's the first item on the list of follow-up work in the repo's contributing guide.
5What it can't tell you
Under the chart, the site now says that these indicators describe the US labour market and don't identify changes caused by AI. That was always the honest position. Job openings count unfilled positions, not jobs or layoffs, and they fall when vacancies are filled or withdrawn as well as when demand drops. A federal ad that mentions machine learning hasn't replaced anyone, and federal hiring isn't the whole labour market anyway.
The ChatGPT line is still there, as context. It marks a date, not a cause.
So the name is still a question, and the dashboard still can't answer it. What it can do is show the numbers correctly and say where each one came from and when it was last checked, which is more than the first version managed. The dashboard updates daily, and the code is on GitHub.